Wednesday, April 22, 2015

European Reliance vs. Genesee Valley Gas

The Greek crisis seems like a never ending drama. My stake in Greece is my European Reliance (EUPIC) position. So I am watching the drama unfold with keen interest. First a little background. Greece faced a major financial crisis in 2011. but gradually came out of the crisis by 2014. Even though its GDP by had shrunken by 40% and unemployment was at 25%, the government deficit was almost nil. Then in the 2014 election campaign the leftest party Syriza ran on a platform of rolling back 5 years of austerity. And they won in early 2015.

Initially after the election, Greece was given temporary support while the new government comes up with a new plan to reform its economy. This hasn't happened so far. So, it looks like Greece will not get further outside help to service its debts, let alone get new loans. But regardless of whether it stays in the Eurozone or not, foreign companies will need to be paid in Euros or dollars or some respected currency. Greece can leave the Eurozone and print Drachmas in the way Zimbabwe printed their currency with reckless abandon. But it won't do any good in paying for imported goods and services. Right now Greece has a deficit about 10% of GDP. Greece cannot have a trade deficit if it cannot borrow money. So, Greece will to go through a lot of internal struggles if it thumbs its nose at the rest of the Eurozone and defaults on its debt.

ATH:EUPIC Genesee Valley
Gas (1953)
Price € 1.26 $ 5.00
Market Cap € 34.65 M $ 0.118 M
P/E TTM 2.8 x 1.9 x
Div yield 0.0 % 0.0 %
P/BV 0.49 0.40
ROE17.8 % 21.1 %
Against this backdrop, EUPIC has been hugely profitable. It has earned € 0.37, € 0.35, and € 0.33 in 2014, 2013, and 2012 respectively. This means the company earns a high-teens return on equity. And the company has ample equity for its business. Its assets are € 330M, its equity is € 70M and its premium revenue is € 166M. So the company is not overextending itself by writing excessive policies.

I believe the company has done well in part because of Greece's bad economic situation. In a society where the government is on the brink of insolvency, people can hardly rely on government social assistance. Therefore, I believe people who have the means would rely on the private sector to provide what used to be from the government; such as insurance for health and pensions. And in the event of a Greek government default or a Grexit, people will rely even more on the private sector.

As I try my best to evaluate EUPIC objectively, I try to imagine what a young Warren Buffett would do if he saw a similar company. That's one main reason why I've been posting so much about his partnership days. And it just so happens that Buffett did see a somewhat similar situation in his early twenties, when he was playing around with a small capital base. He recounts in 2005:
You have to turn over a lot of rocks to find those little anomalies. You have to find the companies that are off the map - way off the map. You may find local companies that have nothing wrong with them at all......

Other examples: Genesee Valley Gas, public utility trading at a P/E of 2, GEICO, Union Street Railway of New Bedford selling at $30 when $100/share is sitting in cash, high yield position in 2002. No one will tell you about these ideas, you have to find them.


So, then I got very interested in Genesee Valley Gas and found it in the Moody's Public Utility Manual. I found that in one year, 1953, the company earned $2.61. Genesee is a tiny cap company even by 1950s standards and so it is very illiquid. In fact I don't know where it was traded let alone the price. But Buffett did say that it was trading at $5. He did not say which year. But using his $5 price in 1953 then the stock was trading at a P/E of 2. However, Buffett failed to mentioned that 1953 was the only year it made that much. In other years earnings was was lower. See chart below. But still it was a very cheap stock.


Genesee Valley Gas is a small-time utility serving Western New York. It only served 28,000 people. During the depression it went into backruptcy protection and was reorganized. I suppose the legacy of that still affected the company almost 20 years later.

Now compare that with EUPIC today. EUPIC is just as solid and it has much more consistent earnings. The PE range is about the same. And both companies sell for considerably less than book. The big drag on EUPIC is of course the Greek macro situation. But as mentioned above I don't believe it will be a total castrophy if Greece defaults or even if it leaves the Eurozone. In either or both cases this company will continue to operate because Greece will no doubt continue to function. If I am right maybe some successful money manager will one day recount how back in the day, when Europe and Greece were in crisis, we could find bargains galore so long as we turned over enough rocks.

I think a young Warren Buffett would approve of EUPIC.

Monday, April 13, 2015

Warren Buffett Partnership Investments

Warren Buffett is becoming a person bigger than life. He is 84 years old now and very coy about when he'll step down from Berkshire Hathaway. He is, however, focusing on the direction of the company after he passes on. I am very skeptical that anyone can control what happens after they die. But if Warren Buffett can, all the more power to him. I just don't think about it too much. Today, my Berkshire position has dwindled down to a small part of my portfolio. And I don't really pay that much attention on what he does for Berkshire today. He is a whale in the business world, and he buys entire large caps such as Heinz, Kraft and Burlington Southern. The domain where he looks for investments is a crowded space. Quality large caps are well covered and sought after. This results in a efficient marketplace where only geniuses like Buffett can generate alpha. I don't try to duplicate Buffett in this arena as it is too hard and risky.

It is hard because the space is crowded with people who are smarter and have more insight and more time than I do. Also, it is risky because I am not a young person starting out. If I was starting out in my twenties and had a small pot of savings I could do this. I can give it a try and possibly make it the start of a great career. And if I fail at it, no real harm I have plenty of time to recover and find my niche. But I am not twenty and I cannot take an excessive risk of failure. So I must choose a path that is more proven and which makes my abilities less of a factor in the method to success.

This is the reason I've settled on the more Ben Graham's cigar-butt type of investing. Ben Graham was Buffett's early mentor and the Graham's partnership ended when Buffett's partnership was just starting out. So both Graham and Buffett ran partnership's in the same era. And during that era both were looking at cigar butts. But while the mentor was beating the market by around 2% per year, the student, in his own words, "Killed the Dow". I think Buffett did better because he thought more about the quality of businesses. So, I think the opportunity for the least work with the least intelligence with the maximum payoff is to do what Warren Buffett did in the 50's and early 60's.

To do this I need to start with as much information about the investments as possible. This post lists sources of information for Buffett Partnership (BPL) investments of the 50s and early 60's. A copy of Warren Buffett's list of his 1962 BPL investments is displayed in the book Of Permanent Value by Andrew Kilpatrick. I want to get coverage on 75% of the 1962 BPL's total equity by the time I am done.

This list is a work in progress. Enjoy!

Stock year Description Source / Link
GEICO1952 He called GEICO his first love Buffett writeup
Western Insurance Securities1952 Buffett sold GEICO to buy Western, which was even cheaper on paper Buffett writeup
Genessee Valley Gas1953
bovinebear blog
Union Street Railway1956 compoundingmachines

The Snowball by Alice Schroeder
Sanborn Maps1961 Workout situation; Buffett bought company to unlock its stock portfolio csinvseting case study

The Snowball by Alice Schroeder
Berkshire Hathaway1962 A pretty soggy cigar butt
(2.4% of partnership)
compoundingmachines
Dempster Mills1962 Control situation
(23.0% of partnership)
csinvseting case study
British Columbia Power1962 Workout situation, recommended by Munger
(11.2% of partnership)
bovinebear blog
The Snowball by Alice Schroeder
Texas National Petroleum1962
(5.7% of partnership)

Trade Like Warren Buffett by James Altucher
Stanrock Uranium Ltd.1962 Workout situation
(5.0% of partnership)
bovinebear blog
Young Spring & Wire Corp1962
(5.0% of partnership)
compoundingmachines
Grinnell Corp1962
(2.9% of partnership)
bovinebear blog
Crane Co.1962
(2.1% of partnership)
bovinebear blog
Black, Sivalls & Bryson, Inc.1962
(1.8% of partnership)
compoundingmachines
Alco Products1962
(1.0% of partnership)
bovinebear blog
Hartford Fire Insurance, INS1962
(-2.4% of partnership)
bovinebear blog


Saturday, April 4, 2015

Earnings on tap: McRea Industries, Senvest, EUPIC, CMH, Putprop

McRae Industries (MCRAA) recently reported H1 2015 results. Revenue in H1 was $57.31 M versus $58.26 M the previous year. And the gross margin was 28.1% versus 30.9% the previous year. This resulted in a H1 income drop of $3.80 M versus $4.55 M the previous year. Despite the slight disappointment, management tone was upbeat. They attributed the lower margin to two main factors. The first is higher costs associated with hiring and training new personnel, which is encouraging because it says they are expanding capacity. The second is due to higher import costs, which is worrying. One would expect that with the dollar getting stronger and stronger that import costs would decrease. On the other hand if most of their imports is from China then that would not apply as the Yuan is actually appreciating versus the dollar. The company did express optimism that demand remain strong in all product segments, so this year results should be on par with last year's record results.

Senvest just reported 2014 results which was as expected given the company posts the results of its funds monthly. Shareholder's equity at year end stands at CDN$738 M or CDN$264 per share. The company currently trades at 64 % of year-end book value. However, it should be even lower considering that after Q1 2015, the Senvest main funds Senvest Partners is up 7% and the Senvest Israel Partners is probably up around the same. The stock today probably trades at less than 60% of book!

Senvest year end 2014 year end 2013 year end 2012 year end 2011
Common equity (CDN$ M) 738 565 331 263
yoy equity gain 31% 71% 26%
Employee compensation (M) 32 43 12.5
Compensation as a
percentage of equity
4.3% 7.6% 3.8%


Senvest is a steal in my opinion. But, there is a lively debate in stock forums and the blogosphere whether the stock is indeed undervalued. The debate centers on whether the management deserves the compensation for the alpha, or lack of, that they generate for their portfolios. The above table shows the employee compensation (management fees) for the last 3 years and their percentages of equity. The fees are from the consolidated balance sheets which is shared by not just the common shareholders but also the outside owners of the Senvest funds and the minority interests. I estimate that the outside owners pay about 1/3 to 1/4 the management fees. And the minority interest is another 10%. So overall, the common shareholders directly pay around 60% of the total employee compensation. So, with this in mind, the fees are around 2.5% in a bad year, when incentive bonuses do not kick in, and it is around 5% in a good year, when incentive bonuses kick in. I think that is reasonable. Back in the day, when I was still buying mutual funds in Canada, the mutual fund management expense ratios could run as high as 2.5%!

I'll be watching the employee expense numbers closely in the coming quarters as the company also said it is expanding its work force in New York.

European Reliance of Greece (EUPIC:ATH) reported earnings of € 0.37 in 2014 versus € 0.35 a year ago. Equity grew to € 70M from € 58M a year ago. This means that the company is now selling for 1/2 book! No doubt the underpricing is due to the ongoing Greek debt crisis. I definitely need to think of the company's contingencies in the event of a Greek exit from the Eurozone, because if I can access the downside I can have a better gauge of whether this company should really be priced at 1/2 book.

Next up are my two South African holdings. CMH, an auto retailer, pre-announced that 2014 headline earnings would be between R2.04 and R1.88 versus R1.58 a year ago. Actual EPS would be between R1.73 and $1.57 versus R1.57 a year ago. Beyond that the company didn't give any more details. So it appears that the company has some one-time charges in the last year, which lowered earnings in a otherwise excellent year. Today the company trades at 9x earnings.

My other South Africa holding Putprop reported sales in line with last year. But a flurry of news made me just too scared and I sold. I think real estate companies are not for my style of investing and it'll be a while before I'll buy another. In the last six months Putprop reported its primary customer was in arrears with rent. It also announced it was doing a rights offer at R6.30 when the stock was trading at R7.00. However, when the rights offering time came, the stock was trading at R6.20! And several board members were replaced at around the same time. All these borderline red flags and the stock's poor performance made me give up on Putprop.

Friday, March 20, 2015

Latest Reading Material

Michael Lewis on Ireland Crisis .

Robert Vinall's fund website contains lots of very insightful and instructive articles.

Warren Buffett's annual letter to Berkshire shareholders. This year includes a blurb from Charlie Munger.

The Education of a Value Investor, by Guy Spier. An extremely candid book about a person's journey towards being a better and better value investor.

Stress Test, by Tim Gneithner. Probably the best first hand account of the financial stress ever to be written. It is eloquent and full of substance and thoughtful ideas for the problems of the financial world. However, I resented the way he dismissed Brooksley Born and her heroic efforts to reign in the derivatives industry in 1999.

How I Lost a Million Dollars. by Jim Paul. A candid story about a persons rise and fall betting in the Chicago Mercantile Exchange.

Interview with Allan Mecham., a rising star in the hedge fund world.

An entertaining article about the Kelly Criteron.

Monday, March 16, 2015

Buffett Partnership Investment: Grinnell Corp.

The 1962 Buffett Partnership had a 3% position in Grinnell Corp. Grinnell Corp at the time was a big player in the fire sprinkler and alarm business. It owned 76% of ADT. Today both companies are part of Tyco.

1962 Grinnell Corp
Price $ 74.500
Market Cap $ 97.93 M
P/E TTM 11.7 x
Div yield 2.7 %
P/BV 0.86
ROE7.3 %
LT Debt/Equity0.00
Interestingly back in 1960s it was mired in lawsuits with the government. The anti-trust authorities accused the company and several subsidiaries of effectively forming a cartel. They collectively owned 87% of the central fire and alarm business. The court battle went all the way to the Supreme Court in 1964 where the company finally lost. By 1966 Grinnell had to divest ADT and two other subsidiaries. If I were Buffett, all this would not detract from the appeal of the company. In fact, all this tells me Grinnell was doing something right!

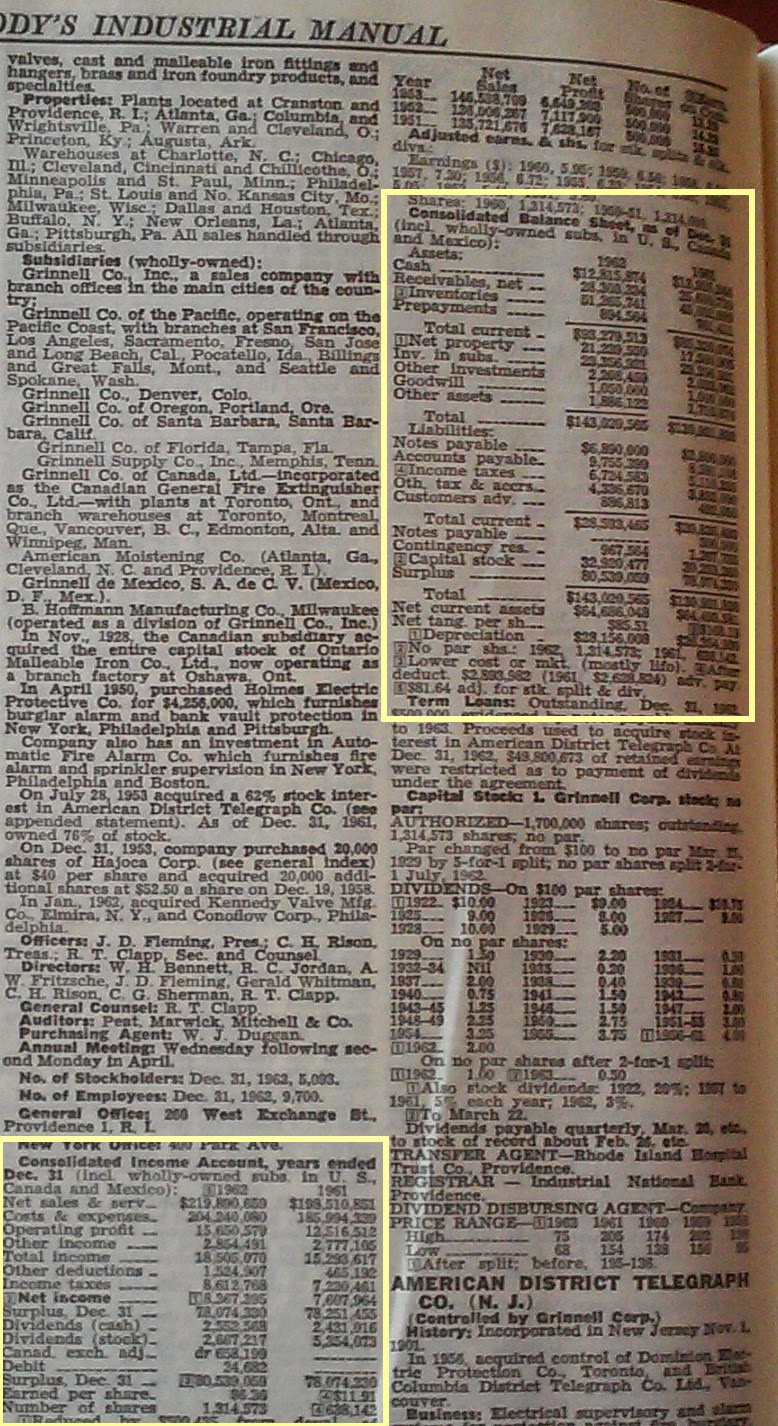
Below is the consolidated income statement and balance sheet from the 1963 Moody's Industrial Manual. The financials there do not include companies which are not wholly-owned subsidiaries. That would mean the financials exclude the full ADT financials. But what this in 1962 means to me is unclear. There are two ways to do this today. One is the equity method in which the income but not revenue shows up on the income statement. The other method is to exclude both income and revenue from the consolidated income statement, and instead just include the dividend paid to Grinnell as income. If it is the latter case then the income statement significantly under-reports income because Grinnell's share of income is $3.2M and its dividend is $1.1M, an understatement of $2.1M. If someone knows the answer please comment. In either case, the company group has great earning potential, and the balance sheet is also understated because it lists the value of all non-wholly owned subsidiaries at only $23M.

I understand the attraction of Grinnell in 1962.

Saturday, March 14, 2015

Buffett Partnership Letters: Crane Co.

Crane Co. is the second company I am covering from the Buffett Partnership.  Back in 1962 Crane Co. was 2% of the Partnership portfolio. It held $200k worth of shares.

Crane Co. (NYSE:CR) is still an independent company today with a $3.7B marketcap. Back in 1962 it manufactured mostly pipes and valves and heaters for industry. Crane Co. was like Alco It traded significantly below book. But being a capital intensive company it wasn't a net-net. And it was a netnet. Below is the company balance sheet from the 1963 Moody's Industrial Manual.

1962 Crane Co.
Price $ 40.250
Market Cap $ 51.7 M
P/E TTM 18.2 x
Div yield 5.0 %
P/BV 0.39
ROE2.1 %
LT Debt/Equity0.18
In terms of profits we'd expect Crane to be better than Alco because Crane is still alive today whereas Alco was defunct by the end of the 1960s. The company's results looked a bit odd. The sales were highest in 1956 and then dipped before coming back in 1962. Income was down from a high of $10.9 M in 1958 to $3.2 M by 1962. Still it paid almost all the income out as dividends.

The 1950s and 1960s were a time of rapid expansion for the company. They acquired several companies over that time and the ups and downs may reflect the understandable problems during mergers. What is certain is that Crane was a player in the emerging industries of that time such as space and nuclear. And they have done alright because they are still around today. So maybe Buffett saw something in the growth prospects as well as the margin of safety on the balance sheet.

Monday, March 9, 2015

Seaboard Corp Reports Record Earnings

Peter Lynch said that an investor should keep tabs on his investments. And this is why I make quarterly posts of my largest holdings. They help me keep abreast of progress in the company. And they allow me to periodically double check my investment thesis.

SEB
Price $ 4039.00
Market Cap $ 4725 M
P/E TTM 12.9 x
Div yield 0.0 %
P/TBV1.74
ROE13.4 %
ROIC 11.9 %
Seaboard is my second largest holding and luckily for me, its stock has been on a tear for the last two years. The company is steadily expanding its footprint in the food industry. But it's core business is still pork. And Seaboard had its most profitable year last year because of great results from the pork segment.

Revenue for 2014 was $6.47 B versus $6.67 B the previous year. Income was $0.37 B versus $0.21 B the previous year. So sales did not grow but profits grew to the highest ever on margin expansion. This margin expansion was all from pork. Pork revenue was $1.72 B versus $1.71 B the previous year. Pork income was $0.35 B versus $0.15 B the previous year. Pork's recent performance was confluence of favourable pork and corn prices. See below.

US Hog Farm Prices
US Corn Prices per Bushel
Corn is the largest component of pork feed and I believe corn price recently is part of a natural decline in commodity prices. Commodity prices are cyclical and the high oil, gold and food prices of the last several years have to go down by definition. Pork prices on the other hand had a temporary boost due to a widespread virus t.hat luckily did not affect Seaboard. As the chart shows pork prices are coming back down in the last few months. But I think the corn and feed price drops will more than offset that.

The other Seaboard segments were generally good. The company's interest in turkey producer Butterball did well reflecting similar dynamics with pork: higher product prices with lower feed prices. And the marine division broke even last year versus a $26 M loss in 2013. I feel the improved fuel costs should help the marine segment to be profitable in 2015.

Sunday, March 1, 2015

Buffett Partnership Investment: Alco Products

To say Warren Buffett has had a productive business career would be an understatement. He has gone from a newspaper delivery boy to a young entrepreneur to a hedge fund manager to the CEO of one of the world largest companies. And he is arguably the world's most well-known and admired capitalist.

Today he is a big-time capital allocator, and probably the best in the world. But I am more interested in learning from him when he was a small-time hedge fund manager. Buffett started several partnerships to invest his and those of close friends and family starting in 1957. Eventually they grew and grew until 1969 when he shut them down and focused on running Berkshire Hathaway.

I think that the value investing world would benefit greatly if more case studies of his partnerships were available.  Some blog articles exist and some books have written about them. Here I will add my first case study of one of his partnership investments from 1962: Alco Products. I found this company from a copy of a handwritten statement of Buffett's holdings from that year. Later, I will post links and resources about the partnerships.

1962 Alco Products
Price $ 19.250
Market Cap $ 33.77 M
P/E TTM 36.6 x
Div yield 1.0 %
P/TBV0.53
ROE1.4 %
LT Debt/Equity0.25
The partnerships had a 1% position in this company. The name Alco originally stood for American Locomotive. The company made steam and diesel locomotives. Later it also produced nuclear energy. In 1964 the Worthington Corporation acquired Alco. The company became defunct in 1969, presumably because of poor sales. Alco's locomotives were later produced by other companies and derivative locomotives are still running in some developing countries.

The company is well past it's heyday. Buffett in those days used the Moody's manual as the guide to companies. Moody's provides condensed info much like yahoo finance does today but with more accurate and useful information. The following is from the 1962 Moody's Industrial Manual, page 1841. As the income section shows, Alco revenues from 1956 to 1961 decreased from $160M to $89M. I have no details on the reasons for the decline. But clearly this is a company in trouble. So, it is puzzling why Buffett owned this back then. I can only speculate. One possibility is that Buffett bought the stock in the 1950's when it was doing well and pared his position as the fortunes went south. It doesn't appear that the low price to book ratio compensates for the horrendous earnings trend. It is also possible that I have made a mistake and Buffett didn't own this company. If anyone knows more about this please comment. Thanks!


Thursday, February 26, 2015

Why I Bought Senvest Capital

I've had trouble finding good values in the Canadian currency portion of my portfolio. In it I owned Andrew Peller (TSX:ADW.A) a Canadian wine producer for the last 1½ years. In that time the stock has returned 15%. However, that is still an overall loss in my "base" currency which is USD. The Canadian dollar depreciated by about 20% in the same period versus the USD.

Wine makers are in a very competitive capital intensive business anyway. I doubt ADW can have outstanding gains in the coming years. Don't get me wrong, it is a decent investment, but nowadays when I make an investment I expect to beat the market.

For this reason, I traded in my ADW for Senvest Capital (TSX:SEC). Senvest Capital is a Canadian investment firm, it owns several subsidiaries. The biggest two are basically hedge funds. One is Senvest Master Fund LP which operates out of New York, and Senvest Israel Partners which invests in Israel. Senvest is a well-known secret in the financial blogsphere. There are numerous writeups about it; I list them below. This article will mostly just summarize what has been written.

Senvest got attention several years ago when it was having very good results and growing equity nicely. I first read the glowing reviews about it 1½ years ago. Since then the the company results have exceeded the most optimistic expectations. The company grew equity from CDN$ 358M in 2012 to CDN$ 630M in 2013. After the first 9 months of 2014 equity grew to CDN$ 684M. The company's 2014 year end results are not out yet, but the fund's results are out. The Master Fund grew by 79% and 22% in 2013 and 2014 respectively. And the Israel Fund grew by 43% and 1%. This hints that the parent company's 2014 results are at least satisfactory. Since inception more than 10 years ago both funds returned more than 20% net of fees!

The parent company Senvest Capital owns 43% of the Master Fund and 48% of the Israel fund. The Master fund is a long/short fund, with about USD$1.4B in over 100 holdings. The fund holdings are known because as a US based company it is required to report its holdings. They are an eclectic bunch of companies with a lot of exposure to tech and pharma/biotech.  SEC does not require funds to reveal short positions but it is around $300M. Whatever the fund is doing is original and excellent. And it is even better that I don't understand it, because if I did I could buy those holdings myself without a middleman.

The Senvest Israel Fund is also attractive investment to me because Israel is an growing and stable emerging market. I have looked into some Israeli companies. But nothing really attractive stood out. And even if I found something, investing in Israel is not easy. The one brokerage that I can use to invest there charges about USD$130 per transaction plus the currency exchange and spread. So, something like the Israel fund is my best way to ride with Israel at a reasonable cost.

The two funds however are still hedge funds, and as all hedge funds, they are expensive. The fee is 1.5% expenses plus 20% of gains as performance incentive fee. I don't think hedge funds in general are a good proposition for that reason. But admittedly, even with that, the Senvest funds have merit.

But there is even more reason that Senvest is a great investment. At the current price of CDN$163, it is selling for 2/3 book! Since I heard about the company, I estimate book value increased by 60% and the share price increased by the same. So in that time the company is equally mispriced. It does appear odd that such a mispricing exists. But I don't fret as to why. As a value investor my job is simply to profit off mispricing.

Seeing as Senvest is a business that makes money from capital gains and dividend income, I found it instructive to see how much of the gains flows back to the Senvest Capital shareholders. The Senvest Capital parent company owns RIMA Senvest Management which manages the investments of the hedge funds and gets the fund's 1.5% and 20% fees. However it keeps only 60% of the fees, the remaining 40% goes to Richard Mashaal whose family owns half of Senvest. So 20%*40%=8% of the investment gains goes to Richard Mashaal as a performance incentive and shareholders can claim the remaining 92% of the gains — for simplicity I ignore salaries and incentives for the other members of the management team. The previous several years report shows that the company's gains are taxed at about 10% rate. This means the shareholder keeps about 82% of the investment gains. And because the stock price is 2/3 of book value, the shareholder gets actually gets 82% ÷ ⅔ = 123% of the investment gains. The following tables compares Senvest Capital stock versus investing directly in the Senvest holdings versus someone who is able to invest in a hypothetical mutual fund that does the exact same thing as the funds and therefore gets the same performance before fees.


Investment in Funds Senvest Capital Mutual Fund
Equity 100% (neglecting expenses)150%100%
Gains 80%123% 100%


Admittedly there is a lot of hand-waving approximations in these calculations. But it shows that the Senvest Capital stock is so cheap that it outweighs the tax penalties of investing through a corporation and the high hedge fund fees.

The biggest risk in this investment, in my opinion, is the performance of the funds. While in theory hedge funds are suppose to hedge the upside and downside, Senvest's funds do the opposite. They are more volatile than the market; the performance will exceed the market during up years and be much worse during down years. That has served the company well in the last two decades, but I fear the funds may suffer some awful permanent loss of capital in a future downturn. But of course the company does have the margin of safety. As well, the company has other investments outside of the hedge funds. For example, it owns unlisted companies as well as REITs. These hopefully will have some uncorrelated risks to the hedge funds. In addition, the rest of my portfolio should have uncorrelated risks from Senvest. I run a relatively concentrated portfolio with about 20 main holdings. And as such I consider risk management paramount.

Below are some useful articles on Senvest.

A recent Barron's article. An earlier Barron's article.
A dated article by oddballstocks
Value Investors Club 2014 article.
Barel Karsan 2015 article.

Tuesday, February 10, 2015

Recent Portfolio News

IEHC recently reported Q3 2015 results. Q3 revenue was $4.73 M versus $3.66 M the same period a year ago. Income was $0.59 M versus $0.19 M the same period a year ago. EPS was $0.26 versus $0.08 the same period a year ago. EPS for the first 9 months was $0.65 versus $0.51 a year ago. So the company is on track for another record year!

The gains came from increased revenue and improved margins. Gross margin was a eye-whopping 39.8% in Q3 versus 31.2% a year ago. It was 35.9% for the last fiscal year, which was a record year. If the company can maintain a close to 2% margin improvement in the current year that would mean a more than 20% income improvement even if the revenue is flat.

The company credits the commercial space for the great quarter. While the military business is a more traditional customer for IEHC, I feel it has plateaued. Instead, I feel the growth will come from the commercial space, in particular the medical and transportation areas.

I feel IEHC is a $8 stock.

Tachibana Eletech just reported earnings that show it is also having a record year. The company earned ¥ 203 for the first 9 months versus ¥ 133 for the same period a year ago. Tachibana is a distributor of factory automation and electronics equipment made by Mitsubishi Electrics. Tachibana serves the Asia region and China is a lucrative market as it modernizes. Exports to China is made even easier because the Chinese Yuan is virtually pegged to the US dollar as it appreciates against the Yen.

Tachibana stock has doubled in local currency in the two years that I've owned it. And to get a better sense of why, I compiled the following data on both companies. The chart shows Tachibana's revenues and that of Mitsubishi Electric. It also shows the revenue of the Mitsubishi Factory Automation (FA) group and the Electronics group. But if we focus on the red and purple bars which are the Tachibana revenues and the Mitsubishi FA revenues, we see they move in tandem. That is very reasonable as FA accounts for almost 50% of Tachibana's revenue. Mitsubishi's stock (TSE:6503) has also doubled in local currency in the last two years. So, Tachibana's success has really been the result of Mitsubishi's success.


Putprop announced it will do a R100M (US$9M) capital raise to buy more properties and diversify away from Larimar, the bus operator that is responsible for 80% of the company's revenue This is a rights subscription to buy shares at R6.30 whereas the stock is at R7.00. So, I feel it is in the shareholder's interest to participate, or sell the stock before the deadline. This capital raise should increase the company market cap from US$20M to US$30M. I haven't decided on my choice because earlier this month the company announced that Larimar was late with the rent. Larimar seems to have some financial troubles and needs a few months to be current with the rent payments. Maybe this is nothing but it caused the stock to drop 10%, and it is factoring into my decision for the rights description right now.

Saturday, January 17, 2015

How I Track Website Changes

Several months ago I failed to act on a pop with New Century Group HK. It was a painful lost opportunity. While I am a long-term investor, I realize it sometimes helps to be prepared to act fast. On that day several things went wrong. One was I didn't get any notice of the early earnings announcement posted on the company website the previous Friday. If I had, I would have been more prepared for the next market open and at least wouldn't have been caught napping, literally. I only found out about the announcement after the pop when I went to the website because I knew something was up.

All US listed companies are required to promptly file any material investor announcements with the SEC. And websites can track the SEC edgar website and alert users of any changes. I use secfilings.com. But I have problem with my small foreign holdings or US companies not required to file with the SEC. All such companies that I own are responsible companies which report anything relevant to the public on the investor portion of their website. But I generally cannot get notifications from them. In the past, I just count on going regularly to the website to check, especially around the time of their quarterly announcements.

I've occasionally thought about tackling the problem of how to track website changes. I researched online and tried some of the nicer online tools, but they all charge for the service — for example, visualping.io. That is reasonable since the tool can only know of changes by brute force query of the site at periodic intervals.

But the New Century fiasco spurred me to action. Instead of paying, I decided — as with everything else I do related to investing — to go DIY. To do this method requires a computer that runs Linux or an unix-like system such MAC OS or Android. And if you must use Windows PC you can install cygwin on Windows. The computer must be connected to the internet, and preferably should be always on. I have a Linux home computer connected to the internet 24/7.

This method checks the websites using a simple Perl script. Perl is a basic command line tool offered in virtually all installations. But if Perl isn't installed, you can easily install it manually. The script, when run the first time, will create a base copy of each website that I want to track. Then every hour it checks those websites again and compares the current webpage with the base copy. If the script detects a meaningful difference, it will stop. The next time the I check on the script window I'll know what website changed. To resume, I can first command it to overwrite the old base webpage copy with the new changed webpage file.

The first part of the script is a list of website URLs. For each URL, I also give it a name and keywords to ignore. The ignored keywords prevent the script from excessively flagging minor changes such as the date or the current stock quote. See below.
$url[$i]{url} = "http://www.putprop.co.za/content/1997/1982/sens-announcements";
$url[$i]{name} = "putprop";
$url[$i]{exception} = "Parsing Time:";
The second part of the script iterates through all the URLs in the database. For each URL, it does downloads a copy of the webpage into temp.html. Next the script filters out any exceptions. Then it compares the temp.html with the previously stored base copy of the webpage. In the above example, the base copy is putprop.html.
$urls = $url[$i]{url} ;
$o = $url[$i]{name} ;
$o .= ".html";
$ret = system ("wget -O temp.html $urls "); }
$temp = $url[$i]{exception};
if ($temp ne "") {
$temp = "-v -E \'$temp\' " ;
$temp = " grep $temp temp.html \> xx ";
print ("exception: $temp\n");
system (" $temp ");
system (" mv xx temp.html");
}

print ("======================================\n");
if (compare("temp.html",$o)==0) {
print ("they are equal $o\n");
} else {
print ("they are NOT equal $o $urls\n");
exit(1);
}
print ("======================================\n");

As the code shows, if the two files match the scripts proceeds. But if they differ, the script aborts. Then I'll know next time I check the script that I should check out that website.

The final part of the script is a loop which wakes up once an hour and repeats the above process. I won't show that portion of the code, but below is a snapshot of how the program looks on my linux-box. Note that it last woke up at 9:24 AM and it has run for 16 iterations without finding any differences. The last URL it looked at belonged to Combined Motor Holdings, a South African company.


If you'd like a copy of the script, please make a request in the comment section.

Sunday, January 11, 2015

Some Reading Material and Thoughts on 2015

Here are some interesting articles I read recently:

How You Know explains that although we may forget the details of all that we've read, the net effect of all we've read shapes our worldview and intuition.

An informative article that explains why microcaps stocks consistently outperform all other larger stocks.

The Best Calls of 2014 on Wealthtrack This is an year end look at the most prophetic guests on the show in 2014.

Ed Hyman's 2015 predictions on Wealthtrack is surprisingly bullish.

Howard Mark's thoughts at year end on oil and the markets: The lessons of Oil

Race to the Bottom is an article Howard Marks wrote in 2007 foreshadowing the financial crisis. I think it is good to occasionally study that period so that we don't make the same mistakes again. I can't help but get a sense that the investor euphoria is slowly creeping back. In the blogsphere, I have heard several people say with a straight face that they target 60% or 40% or whatever. Below is an quote from the article which in turn is a quote from Ken Galbraith.

Contributing to . . . euphoria are two further factors little noted in our time or in past times. The first is the extreme brevity of the financial memory. In consequence, financial disaster is quickly forgotten. In further consequence, when the same or closely similar circumstances occur again, sometimes in only a few years, they are hailed by a new, often youthful, and always supremely self-confident generation as a brilliantly innovative discovery in the financial and larger economic world. There can be few fields of human endeavor in which history counts for so little as in the world of finance. Past experience, to the extent that it is part of memory at all, is dismissed as the primitive refuge of those who do not have the insight to appreciate the incredible wonders of the present.


No doubt you'd have guessed I am not as bullish on 2015 as Ed Hyman.

I highly recommend The Economist Magazine in general. But the Jan 3, 2015 issue called Workers On Tap was especially insightful for me. It helps me think of the economy of the future a bit different. Below is an excerpt:

The other great force is changing social habits. Karl Marx said that the world would be divided into people who owned the means of production—the idle rich—and people who worked for them. In fact it is increasingly being divided between people who have money but no time and people who have time but no money. The on-demand economy provides a way for these two groups to trade with each other.


I've also stumbled upon an article of that analyzes the bond/equity ratio mix in a portfolio. I've thought extensively about this topic. Benjamin Graham advised it as a key tool for his readers in The Intelligent Investor. Graham only discussed the topic in heuristic terms. But I tried to put some empirical substance behind it by doing some simulations. And this is the first time I've seen any articles discussing it empirically. I have taken away a lot of ideas to modify my own simulations. I can't wait to implement them when I get the time. When I do and if the results are useful, I'll post.

Edit (Jan 18): Since I posted this a week ago, I noticed some more excellent material.

Jeffrey Gundlach gives his views and predictions for the coming year on behalf of Doubleline: (1, 2). Gundlach gives lots of non-typical observations and facts. I highly recommend the videos.

Ed Hyman's 2015 predictions on Wealthtrack part 2. Another interesting takeaway, Ed Hyman is bullish on Japanese equities!

Some observations about diversification from an excellent blog.

Thursday, January 1, 2015

Tachibana Eletech Splits Stock

Tachibana Eletech is having a good year operationally. After three quarters, the operating profits are on track to be 10% more than last year. And revenues are on track to be 5% more. However, management also threw in a surprise. They said the company will report an ¥ 62 per share extraordinary profit from acquiring Takagi Shokai Corporation. So, the company expects to a ¥ 204 per share profit for the year versus previously estimated ¥ 142. Takagi Shokai Corporation is a distributor of electronic components similar to Tachibana. Tachibana used to own 48% and recently paid ¥ 703M to increase the stake to 81%. Making Takagi Shokai now a subsidiary of Tachibana.

TSE:8159
Price ¥ 1715.000
Market Cap ¥ 37044.77 M
($ 307 M USD)
P/E TTM 7.0 x
Div yield 1.3 %
P/BV 0.82
ROE11.7 %
ROIC 12.9 %
But how can a company make a profit from an acquistion you say? The reason is simple. Tachibana earned ¥ 1.6B of negative goodwill from buying Takagi Shokai Corporation. Goodwill is the difference between the cost of an acquisition and the book value of the acquisition. Typically, goodwill is positive because the cost is greater than the book value. This is the first time I have heard of a company acquiring another for less than book value. But while goodwill is normally kept on the book as an intangible asset, it isn't so if the goodwill is negative. It is recorded as income on the books.

Going from 48% to 81% ownership changed the treatment of Takagi on Tachibana's books, which prompted the negative goodwill. The goodwill includes all of the value above cost, including cost for the 48% ownership previously purchased. The bottom line is that Tachibana Eletech increased its book value by ¥ 1.6B from this transaction.

Management also announced that they will do a 5 to 6 share split in April 2015. It seems like a rather odd thing to do. Maybe management feels the current stock price is getting too high and they want to lower it, but not too much.

Now I sense the company is doing something to increase shareholder value. This stock has doubled in the less than two years that I owned it in local currency. But in USD, it is up only 61%. That's one thing to keep in mind, the Japanese stocks and indices look great in the last two years but it is partly, if not mostly, due to the monetary easing by the Abe administration. And what works can also turn on you. If the yen strengthens, the market will probably tank. But I don't think too much about currency because it is almost impossible to predict. But regardless of the currency, I am very pleased to see the stock trading closer to book. And the company's balance sheet may also be understating the true book value as this acquisition shows. The company has small holdings in 30 other companies worth ¥ 8B. These holdings are carried at cost and may be worth much more. In any case, I feel that the book value is the fair intrinsic value for Tachibana. I will only consider selling when the stock reaches book value.

And finally, Happy New Year!

Saturday, December 20, 2014

My Trip to the McRae Industries Annual Meeting

After owning McRae (MCRAA) for two years, I've seen the stock double. After such a runup, it is always prudent to re-evaluate the investment. To help me re-evaluate MCRAA I decided to trek to North Carolina for the company's annual meeting held on Dec 18.

The trip was a success for me. First and foremost, I got a basic education about the company. I am surprised at how little I know about the company! I mainly put the most weight on the the financial statements for my investment decisions. But McRae's core business of selling boots has nearly doubled in the last 5 years. And anyone that invests in the company now must understand what the company does. The company is no longer a simple balance sheet purchase like it was when I bought two years ago; the stock is so much higher now.

The following from the company's website sums up its history well.

McRae Industries was founded in 1959 by Branson J. McRae with the primary focus of manufacturing high quality children’s shoes. In 1966, during the height of the Vietnam War, McRae received a contract award from the U. S. Government to manufacture military combat boots for the United States Army using the “direct molded sole” design. As a result, McRae Industries’ Footwear division has provided quality combat boots to the men and women serving in the U. S. Army for more than 40 years.

In a strategic move in 1996, McRae Industries purchased American West Trading Company, a manufacturer and seller of a variety of western boot products. During the 2002 to 2006 time period, the array of western boot products was significantly enhanced by the acquisition of several popular brand names – Dingo, Dan Post and Laredo. Also, during this same period of time, the company’s name was changed to the Dan Post Boot Company to more closely identify our products in the western boot market. In 2005, Dan Post Boot Company became a licensee of John Deere and began to design and market men’s and women’s work boots along with a line of children’s shoes and boots. Dan Post continued to expand its product mix in 2008 with the addition of the durable, price effective McRae Industrial line of work boots.


The company gets 1/3 of its sales from its commercial line and 2/3 from its western/lifestyle line. But the latter only started in 1996 and really took off in the mid 2000's when it purchased several companies in financial troubles. So the company, despite being in business for over 50 years, really took off in the last 10 years or so. And it makes talk about expansion more believeable. The company's FCF is around $6-8 mil a year, and management is thinking of using that money prudently for expansion. Initially, I was skeptical because I didn't realize that the company's western sales only got started in the last 20 years. And I thought if you haven't successfully expanded much in 55 years, why do you think you can now? But now I am willing to think of the company in the present form as only about 15 years old. It was only in the last 15 years that Gary McRae has run the company and has divested itself of the printer and bar code machine business. And most importantly in the last 15 years the company bought the various western boot businesses.

I personally don't have knowledge of the western boots that McRae is known for. In the future I'll definitely pay more attention to the boots that women wear, especially when I am in the South. So, I do not have an informed opinion of McRae's industry. Anyway, fashion market and trends are difficult to predict even for the experts. So really the only thing I can go by is the past results. And the past results show that McRae has expanded prudently, the company has executed well and management has been spot on diving into a lucrative market. The company did $104 M, $97M and $76 M in revenues in 2014, 2013 and 2012, respectively. The company also just reported Q1 revenue of $29.2M versus $31.7 M a year earlier. I wouldn't be surprised if revenue is slightly down this year versus 2014. However, this is still satisfactory considering where revenues were just a few years ago. If earnings plateau, the stock is a reasonable value. But if management can grow revenues and earnings over the next several years like they have for the last several years, this company can turn into a growth stock and would be ripe for acquisition. In that scenario I think a larger player must offer at least $60 a share for company. Compare this with Justin, one of the biggest players in the western boot business. Justin was a public company until 2000 when Warren Buffett bought out the company for $600M. At the time of his purchase, Justin was selling at about 20 times earnings and two times book. To buy McRae with those kinds of multiple would mean more than $60 a share.

I think this trip was invaluable for me. It also didn't feel like work. It was more like a learning experience and vacation rolled together. I saw the factory where they made their military boots — their western boots are outsourced to overseas suppliers. The management is very respectful and friendly towards the employees. But they are also capable of making the tough but necessary decisions to move manufacturing jobs overseas.

I also learned their VP of finance Marvin Kaiser will be stepping down. His replacement-in-waiting is now bringing up the Enterprise Resource Planning (ERP) software. Management is making an effort to improve the company. Ultimately, the results should show up in the books through improved margins, lower inventory levels, etc. Margins have dropped slightly in the last year and it definitely isn't due to pricing pressure. Management told me they are working on reversing the margin trend. This is probably my biggest area of concern.

Microcaps like this have very little coverage and insight into management. Furthermore, management in largecaps probably have no time for small individual investors. But for small companies this isn't so. I have heard of several successful smallcap money managers who regularly visit company management. Warren Buffett in his younger days used to drive around the country visiting management. Lynch also used to crisscross the country when he ran the Magellan Fund, And Francoi Rochon of the Giverney Capital also visits management regularly. This is my second company visit and I hope in doing so to emulate a bit of their success.

Sunday, December 14, 2014

What Just Happened in Hong Kong?

On Monday morning Nov 24th Hong Kong time, the market opened with New Century Group Kong Kong (HK:234) opening up slightly at around HK$ 0.16. But 15 minutes into the trading session, all hell broke loose. The stock jumped to HK$ 0.40! That is a 160% rise! But it was too good to last. After two hours it fell back to around HK$ 0.25, which was still up 66%. There it stayed for the rest of the day.

The spike was ostensibly because of an early announcement that H1 earnings are up 390% yoy which, on the face of it, sounds great, until you realize that still means only 0.65 HK ¢. But I guess some investors didn't bother to download last years H1 to see what the announcement really meant, and bid up the stock to HK$ 0.40. For the next three weeks the stock slowly drifted slower to just HK$ 0.166! The falling chart shows the painful descent.

HK:234 Daily Closing Stock Price


And no, I didn't sell it all at the top! I was napping when it happened! Now that the stock is back to just 10% above the level before all this happened, I wonder how could a stock spike up 150% and then drop 60%. Who could have made such a colossal mistake by buying at such high levels? In hindsight, I am sure I didn't miss some behind-the-scenes event. My theory is it happened partially because some buyers did not understand initially that earnings was just up to 0.65 HK ¢, and partially because of an influx of new buyers from Shanghai through the Shanghai-Hong Kong Stock Connect.

The Shanghai-Hong Kong Stock Connect is a pilot program to help China open up its capital markets. Up until Nov 17, Chinese citizens cannot normally invest outside China, nor can outsiders invest in exchanges in China. When I say China I am referring to mainland China excluding Hong Kong. So many chinese companies list on foreign exchanges to get access foreign capital. Alibaba is probably the most well-known example.

The Connect allows any investor in the Hong Kong Exchange to buy certain securities in the Shanghai Exchange. It also allows qualified investors in China to invest in Hong Kong Stocks through the Shanghai exchange. This is the path for China to be a free capital market. However, there is a caveat. On each day there is a limit of how much Shanghai stocks and Hong Kong stocks can be bought by the other market. And there is also an aggregate limit. The aggregate limit is RMB 300 bil for Shanghai to purchase on the Hong Kong Exchange and RMB 250 bil for Hong Kong to purchase on the Shanghai Exchange. The aggregate limit is like the seating limit in a restaurant. Once the limit is reached, waiting customers have to wait for seated customers to leave before getting service. So, once the RMB 250 bll limit is reached, investors in China can no longer purchase Hong Kong stocks until investors in China sell some Hong Kong shares. This means the maximum outflow of capital from China is RMB 250 bil, which is a just 1% of the total RMB 24 bil market capitalization of the Hong Kong exchange. But this may just be enough to tip stocks significantly higher, like what happened to New Century Group. After all, Chinese retail investors are probably less savvy than Hong Kong investors and are much more prone to speculation. And what happened is clearly a case of speculators gone wild.

The current aggregate quote for purchasing Shanghai stocks is RMB 241 bil out of RMB 250 bil. So, it is at the limit meaning there is still pent up demand for Hong Kong stocks.

The current aggregate quote for purchasing Hong Kong stocks is RMB 235 bil out of RMB 300 bil.

HK:0234
Price HK$ 0.166
Market Cap HK$ 957.82 M
($ 123 M USD)
P/E TTM 16.1 x
Div yield 3.9 %
P/BV 0.65
ROE4.0 %
LT Debt/Equity0.11
New Century Group has three main lines of business. One is cruise lines; they own two cruise ships. But that business is low margin and often not profitable. The other is real estate, mostly hotels in Hong Kong and Singapore. One contributor to the increased earnings was the disposal of a hotel in Indonesia. The company properties are valued at HK$629M. The third line of business is securities trading. The biggest contributor of the increased earnings was fair value gains in this line of business. The value of the cash and securities on the books is HK$993 M. The company's equity is HK$1.5 bil, the market cap is HK$ 957M. Note that the market cap is less than the cash and investments on the books! So a shareholder can pay for his shares with the liquid assets on the books and get the profitable real estate minus a small amount of debt for free!

In hinhsight, I should have sold the shares at HK$ 0.25 when it was trading about book, but no point in crying over split milk. I think the shares now are undervalued because of the price to book ratio. In addition I feel Hong Kong stocks can be a play on a more open China capital market as the events of the last three weeks showed. And finally, I feel the Hong Kong stock market is undervalued in general, so investing in this company is like buying a undervalued close-ended equity fund.

Sunday, November 30, 2014

I Just Bought My Second South Africa Stock

In the last year or two the US economy has been looking stronger and stronger. It is quite clear by now that it is in the middle stages of a recovery from the recession that began in 2008. Unemployment is going down as smoothly as a plane coming in to land. The fiscal deficit is down from the abnormal levels at the height of the recession. Housing inventory is no longer full of bank-owned foreclosures. US manufacturing is making a comeback and US is producing record amounts of oil. Consequently the US dollar is at the highest level in four years. The market appears to be fully aware of this and the US market valuation reflects this economic situation. So though the economy still has room to run, US companies are probably fully valued. Indeed, I am finding it harder and harder to find those knock-out bargains of two or three years ago. That is why I have been buying outside the US recently. This is all a drastic change from 5 years ago, when news pundits were saying that the US will become a banana republic. Well I have a saying: You're never as good as everyone tells you when you win, and you're never as bad as they say when you lose.

I also find it interesting that the market has taken the opposite view of the emerging markets six years ago and today. In the last year or two, money has consistently flowed out of emerging countries. The headlines are full of bad news everywhere you look. Greece has 20% unemployment. Russia doesn't respect shareholder's and will steal or confiscate at will. China has a colossal property bubble. Hong Kong is too close to China to be immune. In fact that goes for every other country in Asia. Japan is growing old and will forever be in recession. Brazil, Indonesia and South Africa all have their own problems which has resulted in high inflation and capital flight. This juxtaposition of emerging markets and the US may be partially based on fact but I think it is also very much a matter of psychology. Someone always has to be a darling and someone always has to be the dog.

One often overlooked market is South Africa. South Africa is the second largest economy in Africa, which is the most underdeveloped continent. Parts of Africa have the most potential to achieve spectacular growth in the coming decades, possibly like what China achieved in the 80's and 90's. South Africa is also friendly towards foreign shareholders. It has an Anglo-Saxon system of law and corporate governance. All financial documents are in English.

CMH
Price R 13.000
Market Cap R 1216.80 M
($ 107 M USD)
P/E TTM 7.8 x
Div yield 6.0 %
P/BV 2.15
ROE27.7 %
ROIC 12.8 %
South Africa does have the drawback that it is a relatively mature economy. Its GDP growth has slowed in the last year. And the country has suffered some major setbacks in the last year. South Africa is known for having a restive labour force. Strikes are common and can get violent. But this year has seen the most damaging strikes in South Africa history. The economy even shrunk in the first quarter because of the strikes. By now, however, the strikes have ended and the media seems to indicate that South Africa will have a more productive coming year. In view of this, I want to maximize my exposure to the South African consumer. And so I bought Combined Motor Holdings (JSE:CMH).

Combined Motor Holdings owns several related businesses, with the majority of revenue and profits coming from car retail. Car retail in a developing country caters to wealthy and upwardly mobile consumers. In any up and coming country, the people yearn for a taste of the luxuries that they have only seen from afar in the past. In addition, they want to differentiate themselves from their less well-to-do peers. Furthermore, cars in South Africa are even more critical than in more developed countries because South Africa has a primitive road and public transport system.

The Group's other subsidiaries are Car Hire, Marine and Leisure, Financial Services and Corporate/Other. These other businesses are 12%, 0%, 13% and 5% of profits respectively. The Marine and Leisure subsidiary is troubled and it accounts for only 1% of total revenue of the group. Management hinted that it may be sold or closed down.

In the the company report, the CEO describes the company philosophy:
The Group’s management style remains one of decentralised operating and marketing complemented by centralised cash flow monitoring, accounting controls and internal audit. Remuneration of management and staff is linked to performance benchmarks, all of which are closely monitored using internally-generated measurements, and peer group review. The Group operates in sectors which produce very low margins, so tight control over expenses and cash flow is vital to success.
This kind of operation reminds me of Buffett's operations and the businesses described in The Outsiders by William Thorndike. The company focuses on cash generation and increasing value for shareholders.

CMH is a company with good profits but also with a large balance sheet. At any given time the company has more than a billion Rand of inventory. But this is still just a month's turnover. The company has an impressive 27% ROE. And I estimate the company's ROIC is 13%. These numbers hint that the company is profitable in part because of a high debt exposure. However, management has said that all debt is short term. Most of the company's R$ 1.5 bil liabilities is accounts payable or short term borrowings. And all the borrowings are in Car Hire division, secured by its car fleet. I take this to mean that the parent CMH does not guarantee the debt. The rest of the liability is mostly payables for their cars held for sale.

I read the annual reports going back the last five years. The management consistently articulates the company's situation well. The CEO and Chairman have run the company since 1976 when it was a single car dealership.  The directors combined own 70% of the company. They have aggressively used cash to increase shareholder value; they pay a high dividend (6%) and earlier this year, the company bought back 15% of the float at R 13. Share buybacks is a second trait that Buffett likes, and it is the MO of The Outsiders . I think it is possible that this company can be the type of exceptional company described in The Outsiders.

The following shows the per share performance of the company:

CMH - units of Rand per share

As one can see, the company does pretty well for all shareholders even though it is very closely owned.


Monday, November 17, 2014

Riken Keiki Q2 Update

7734
Price ¥ 1036.000
Market Cap ¥ 24.04 B
($ 208 M USD)
P/E TTM 9.2 x
Div yield 1.7 %
P/BV 0.77
ROE8.4 %
ROIC 12.2 %
Gross Margin47.4 %
Riken Keiki recorded yet another outstanding quarter. That is a string of improving results over that last few years. The first half sales increased 7% but income increased 32%. And what strikes me about the recent company performance is the steadily improving margins. So far this half the gross margin is 47.4%. And from 2009 to 2014 the margins were 40.3%, 42.9%, 40.0% 42.6% and 46.7%, respectively. Operationally, the company must be doing something right, or it could be favourable effects of the exchange rate, or both. Foreign sales are just 22% of total sales.

For any foreign investor in Japanese stocks, any recent good news is overshadowed by the terrible Q2 GDP numbers. The country slipped into recession as it followed the previous quarter's 7.3% GDP drop with a 1.6% GDP drop. This caused a even further slide in the exchange rate. Today a dollar costs ¥106. However, I am stinking to Japanese investments for now because I don't think there can be sustainable pressure on the Yen. The Japanese current account is still positive this year, meaning that more money flows into Japan than out. In fact, I think I am going to buy some more Riken Keiki shares!

Saturday, November 15, 2014

IEHC Q2 Update

IEHC
Price $ 4.910
Market Cap 11.31 M
P/E TTM 9.0 x
Div yield 0.0 %
P/BV 1.04
ROE11.5 %
ROIC 15.6 %
IEHC reported Q2 earnings that I felt was quite reasonable. The company EPS for the 6 months this fiscal year is $0.35 versus $0.44. Revenues fell slightly (3%) but the bigger reason for the earnings drop is that margins fell from 63% to 61%. But last year earnings petered out in the second half and year-end EPS was $0.63. I expect earnings this year will be at least as good. So this is a long-term growth stock that is trading at 8x forward earnings. Apparently, other shareholders didn't agree with me and sold off the stock after the earnings. The stock dropped 10% on the news and I used this opportunity to double my position.

In other news, I closed my KCLI and ITIC positions. KCLI has run up a bit and it is a cigar butt that probably has one or two inferior puffs left. But I think I can better deploy my capital elsewhere. And I sold ITIC because I felt my original thesis was a mistake. The company had great margins in 2013 due to unusually low claims, and not surprisingly, this is not looking to be the case in 2014.

Wednesday, November 12, 2014

McRae Posts Second Consecutive Strong Year

McRae Industries reported year end earnings that was flat compared to a year earlier. Both 2013 and 2014 earnings were $7.5M despite a revenue increase from $97.1M in 2013 to $103.6M in 2014. The reason was that margins fell from 70.9% in 2013 to 69.6% in 2014 which negated the $ 6.6M increase in sales. The margin compression was due to higher cost of imported products, and management feels this will continue next year. However, I wonder if management is too pessimistic as the recent higher US exchange rate should lower import costs.

MCRAA
Price $ 31.500
Market Cap 76.55 M
P/E TTM 10.1 x
Div yield 1.7 %
P/BV 1.23
ROE12.1 %
ROIC 18.7 %
The company's two sales segments were both strong. The western/lifestyle products business grew from $62.8M to $66.3M and work segment sales grew from $33.3M to $37.0M. Management foresees both segments continuing their strong performance in 2015. Management expects strong demand in the lifestyle segment which is not surprising considering that the US consumer is coming off five years of deleveraging and high unemployment. As the US economy rebounds in the coming year, consumer optimism will only increase pent-up demand for fashionable items such as boots. The work segment relies heavily on just a few military contracts and so this segment is more predictable short-term. And here management feels the current contracts will give this segment a strong 2015.

At current valuation, the numbers for McRea are quite impressive. The ROIC is 18.7% ! This number shows that the company has a lot of ancillary investments and cash on hand and the company is a lean operation. McRea does minimal advertising, if at all. This means the company cannot drive its growth; it just goes with the flow of the business cycle. I am just happy after an awesome 2013, the company maintained its results in 2014. If the company keeps this up, it will grow book value by $7M a year. Then, they will probably have to give a special dividend. I estimate this company's intrinsic value at $40.

Tuesday, November 11, 2014

2014 Good Year for Insurance

My insurance holdings are all doing well in 2014. I am not a swing-for-the-fences type of guy. I'd much prefer staid consistent returns. And insurance companies give me that — for now. Insurance companies are strictly regulated in the US. An insurance company requires a license from state regulators in whatever state it wants to operate. The regulators set guidelines for drawing up the liabilities, i.e., the reserves. This is especially true for life insurance companies. People's life expectancies are very well understood, and when a company combines thousands of policies together, the result is a very predictable income and payment stream. Life insurance is also a commodity because there is little room for innovation. For these reasons, life insurance companies are in a competitive low-margin business. On the other hand, many trade considerably below book. Kansas City Life (KCLI) is a case in point. The company's 3 month and 9 month earnings so far this year are in line with last year. But this is just a 4% return on equity! This is a paltry return for a company with no top line growth.

I also own AIG. AIG specializes in both life and property and casualty (P&C). The company's third quarter results was pretty much inline with a year ago period. AIG is now in its first quarter without Benmosche as CEO since 2009, when he steered the company out of the financial disaster. AIG's return on equity is better than KCLI but its relative market to book value is about the same, as shown below. But AIG is a more dynamic company and has much greater potential to improve results despite its larger size.

For comparison purposes, I have also included in the table two life insurance companies that I do not own. Independence Holdings (IHC) sells life and health insurance, and National Western Life (NWLI) sells life insurance along with a lot of annuities. The final insurer in the table is European Reliance (EUPIC). This company sells life, health and car insurance, among other services. It looks better than the others by all metrics. The downside to the company is that it is in Greece. But I bet few would know that after four years of negative GDP, the country is poised to be positive again in the coming quarter. And in my opinion, the dirt cheap stock price gives me ample margin of safety against the company's risks; I EUPIC is a much better stock to own than KCLI. And therefore, I plan to close my KCLI position and use the proceeds to add to my EUPIC position.

KCLI AIG IHC NWLI ATH:EUPIC
Price $ 50.000 $ 54.000 $ 14.220 $ 271.970 € 1.440
Market Cap 548.40 M 75.60 M 249.96 M 988.88 M € 39.60 M
($ 49 M USD)
P/E TTM 19.5 x 8.5 x 10.9 x 9.4 x 3.9 x
Div yield 2.2 % 0.9 % 2.5 % 0.1 % 0 %
P/BV 0.72 0.70 0.85 0.64 0.60
ROE3.7 % 8.2 % 7.8 % 6.9 % 15.5 %
ROA0.62 % 1.68 % 1.95 % 0.94 % 3.25 %


ITIC also reported earnings. The company earned $7.0M for the first 9 months versus $13.0M last year. This dramatic drop was not because of a drop in revenue, which was only slightly down, but due to positive effects of claim provisions last year. ITIC sells title insurance; however, I don't really think of it as an insurance company like the other five mentioned in the earlier table. Title insurance claims are a tiny fraction of the premium — less than 10% — and they don't take long to occur. If a claim is made on a policy it usually happens within a few years after purchase. Also, part of the cost of the title insurance policy is the title search that the insurer must perform. So, ITIC can be considered a service company as much as an insurance company.

And my fifth and final insurance company, Wellpoint, reported Q3 revenues up 4% and income up 3%. And most importantly, year end EPS guidance is now around $8.88, up from $8.81. The stock has gone up almost 40% year-to-date. Even the midterm elections last week couldn't drag it down. The Republicans now control both houses of Congress and now can ram through legislation to repeal Obamacare. Their rhetoric says they will too. Of course if they do president Obama will veto it and the Republics do not have the votes to override the veto.

Still, I was pleasantly surprised at the lack of reaction from the market. But I am really not at all concerned by the election results. Obamacare is most widely know for the individual mandate, which is mostly provided by the public exchanges. But the public exchanges only provide 750k customers out of 37M. Wellpoint is doing well now mainly because of better management and the benefits from medical insurance expansion through many aspects of Obamacare. If the Republicans do succeed somehow in changing healthcare, it will only be to tweak this system of private insurance with subsidies for the poor. But the spirit of Obamacare is here to stay. So Wellpoint will benefit no matter which party runs the government after Obama leaves in 2017.

Saturday, November 1, 2014

Seaboard Q3 Earnings

SEB
Price$ 3072.000
Market Cap$ 3594.24 M
P/E TTM10.2 x
Div yield0.4 %
P/BV1.36
ROE13.4 %
LT Debt/Equity0.00
Seaboard Corp (SEB) recently reported Q3 results. Revenue was $1622.6 M versus $1648.1 M the previous year. Income was $104.7 M versus $26.0 M the previous year. So revenues dropped slightly but profit quadrupled. This was not a total surprise because of the jump in pork prices over the last several months. The pork division increased its operating income by $45M. The recent disease that hurt the pig industry has subsided. And pork prices have pulled back from the highs of the summer. However, my reading of the industry tells me that the pig crop won't be much higher next year because of the low birth rates this year. So, I expect higher pork prices for another year or so resulting in continued good performance from this division.

But pork wasn't the only division benefiting from commodity prices. Poultry prices are also at record highs this year, and so the Butterball operating income increased by $18M. Both meat divisions are benefiting from lower feed prices also.

The marine division and the sugar division increased their incomes by $10M and $6M, respectively. The marine division narrowed its loss this quarter in part because of cheaper fuel.

I have held this stock for close to a decade and have watched its performance ebb and flow with commodity prices. However, I think we are at a good point in the cycle. Feed crops such as soy and corn are now lower because of increased production and less emphasis on ethanol, which I think was a tremendously misguided effort by American government to use more renewable energy sources. At the same time, I don't think commodity prices are so low that producers like Seaboard will be unprofitable. So, Seaboard is going to a few more good years yet!

Thursday, October 30, 2014

Hanover Foods 2014 Results

HNFSA
Price$ 110.000
Market Cap$ 82.08 M
P/E TTM12.0 x
Div yield1.0 %
P/BV0.37
ROE3.1 %
LT Debt/Equity0.003
Hanover Foods just released its 2014 year-end results. Revenue was $429.0 M versus $443.8 M the previous year. Income was $6.9 M versus $12.1 M the previous year. Gross margins fell to 10.5% from 11.6%. Management did not make a single comment to explain the drop.

However the report did clarify the matter of the total outstanding shares. Apparently, the internet and blogsphere has been confused what that number is. It is a total of 746k A and B shares. A and B shares have same economic value but only B shares have voting rights. The company also gave hints as to the value of the shares. The company has a small amount of outstanding B shares in its employee incentive plan. The company at times buys back these shares when vested from the employees at $155. This is a $45 premium over the most recently traded A share price. The company does this probably because there is no real market for the B shares. I own the A shares, which are much more commonly traded on OTC.

The company made progress to reduce long-term debt to virtually zero. It also increased cash by $3M. So at least management isn't squandering earnings. But there is no getting around the fact that this is a low-return business. A 3.1% return on equity means that this business is no better than 10-year treasuries. Despite this I own this stock because it trades at less than 1/2 book. This is the classic cigar butt. I think and hope that this company can be acquired for twice the market value. But I have no idea whether the Warehime family want to sell. But while we all wait for some kind of an exit scenario, the company must work on improving operations. I have yearly data going back 4 years and it shows a distributing pattern. See below (all numbers are millions).

2014 2013 2012 2011
Revenues 428.9 443.8 439.0 425.1
COGS 383.9 392.3 380.2 371.6
Gross margin 10.5% 11.6% 13.4% 12.6%
Operating margin 2.4% 3.8% 4.8% 4.3%
Net income 6.9 12.1 13.6 12.3
Equity 221.1 213.3 200.9 188.8

Again, I don't know the reason(s) for the decline. I can only speculate that commodity prices may have played a major role over the last 4 years. But commodities prices are coming down worldwide. I will closely watch the results in the coming quarters. I certainly hope and expect it to improve.