| 1962 | Grinnell Corp |
| Price | $ 74.500 |
| Market Cap | $ 97.93 M |
| P/E TTM | 11.7 x |
| Div yield | 2.7 % |
| P/BV | 0.86 |
| ROE | 7.3 % |
| LT Debt/Equity | 0.00 |
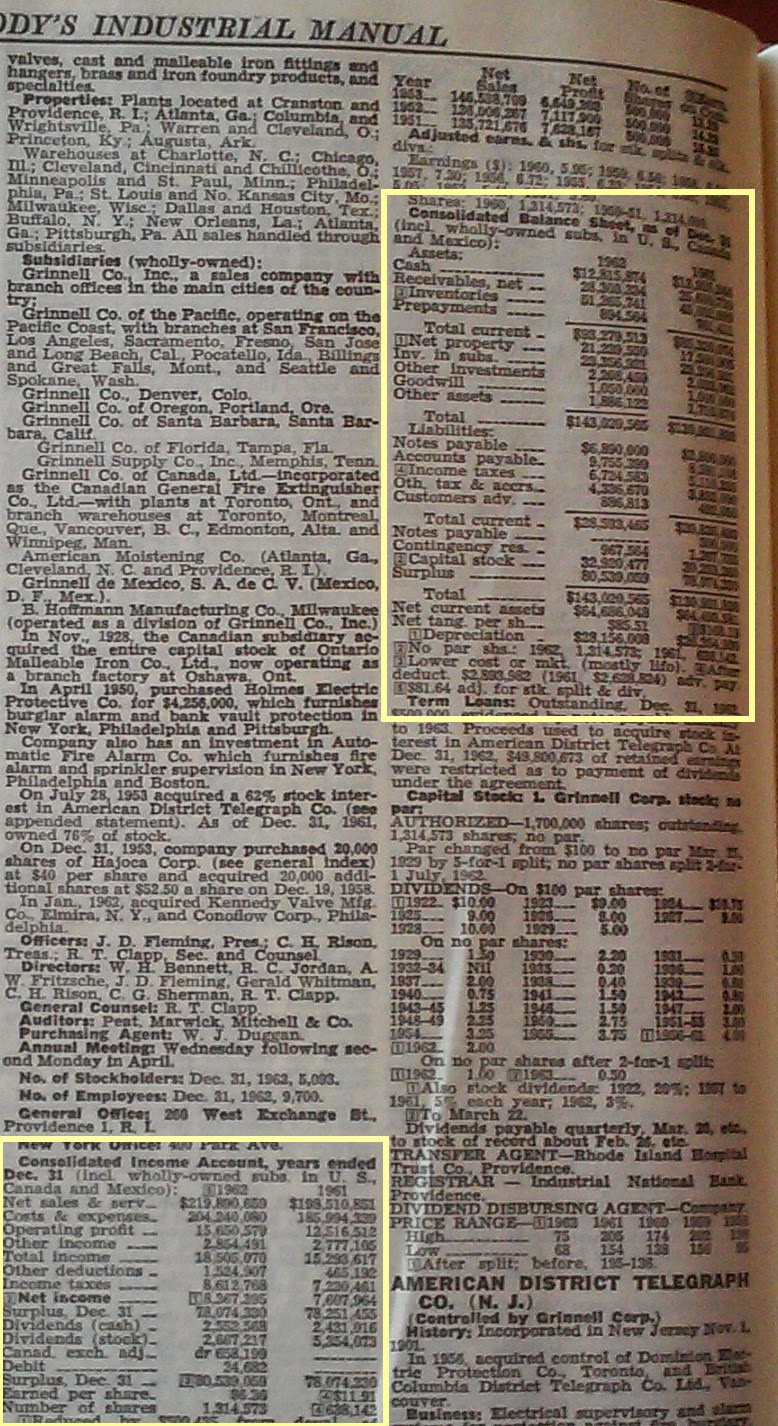
Below is the consolidated income statement and balance sheet from the 1963 Moody's Industrial Manual. The financials there do not include companies which are not wholly-owned subsidiaries. That would mean the financials exclude the full ADT financials. But what this in 1962 means to me is unclear. There are two ways to do this today. One is the equity method in which the income but not revenue shows up on the income statement. The other method is to exclude both income and revenue from the consolidated income statement, and instead just include the dividend paid to Grinnell as income. If it is the latter case then the income statement significantly under-reports income because Grinnell's share of income is $3.2M and its dividend is $1.1M, an understatement of $2.1M. If someone knows the answer please comment. In either case, the company group has great earning potential, and the balance sheet is also understated because it lists the value of all non-wholly owned subsidiaries at only $23M.
I understand the attraction of Grinnell in 1962.

No comments:
Post a Comment